前言
使用 canvas 来实现简单的批注功能。
最近,公司需要做(抄)一个和剪映相似的页面,点我直达。
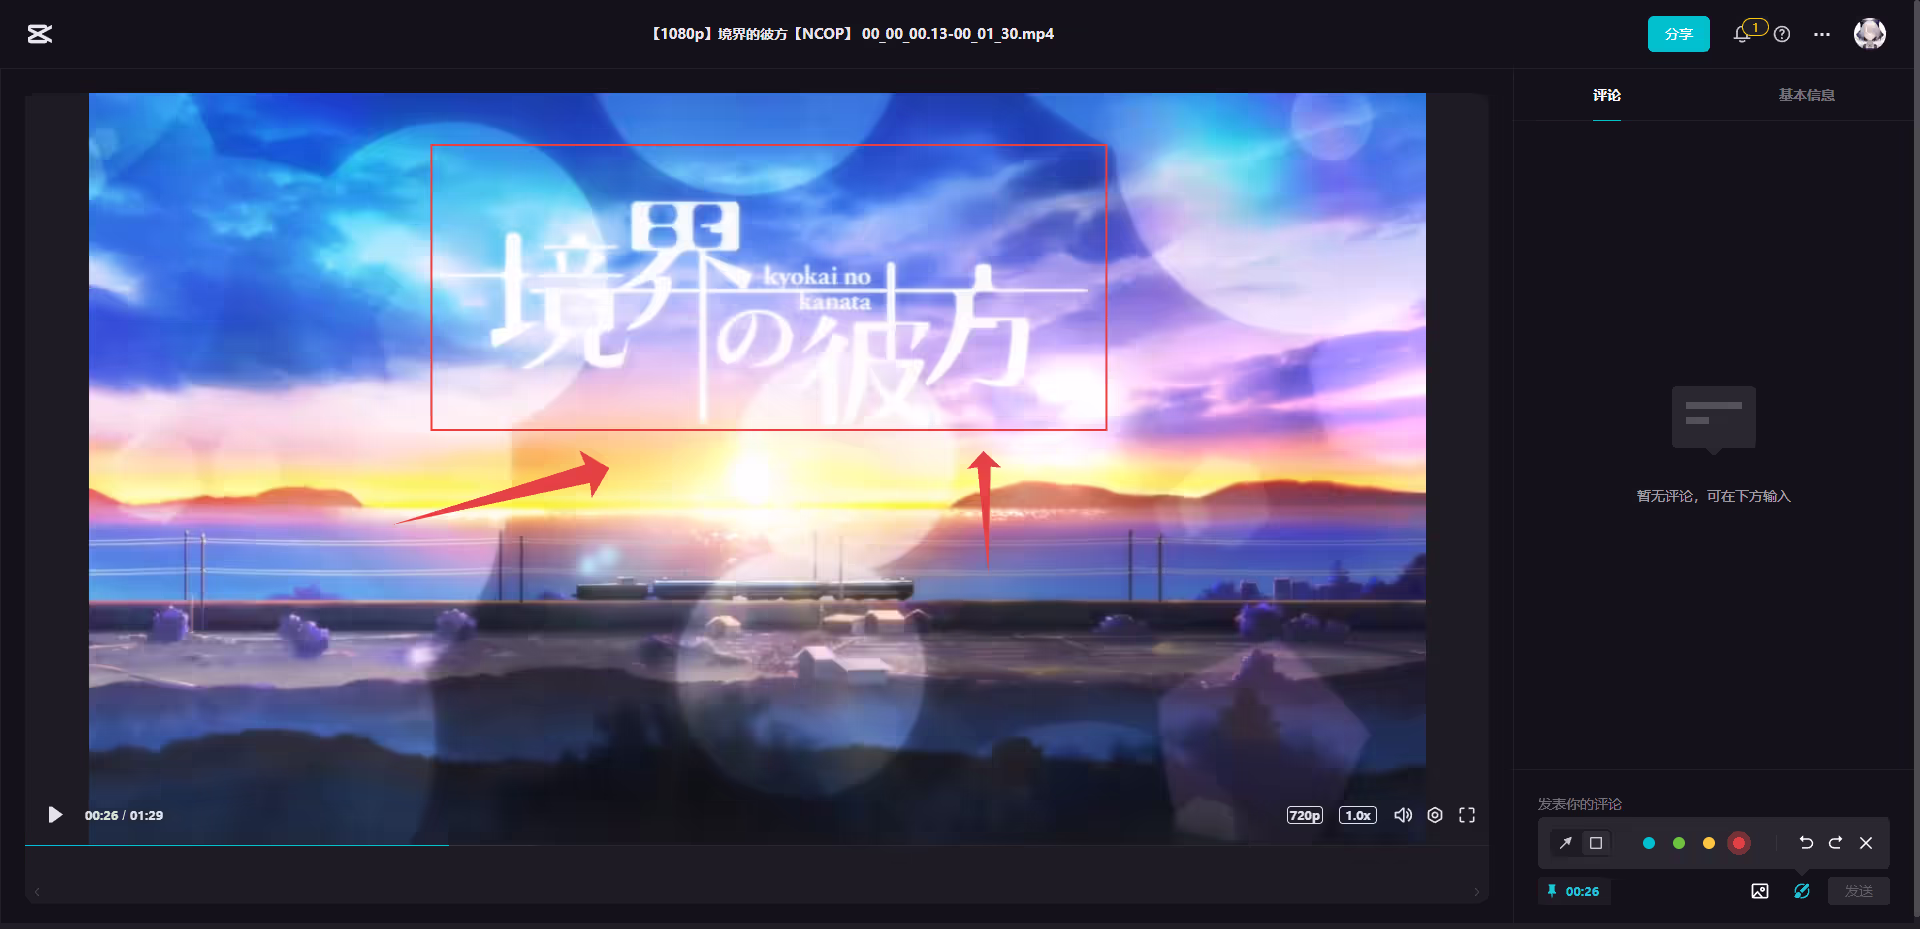
在剪映中,有一个批注的功能,能够对视频画面进行标注,效果如下:
![]()
在经过我对 dom 的分析之后,我发现这个功能是经过 canvas 实现。
具体就是在视频容器的区域内套一个 canvas 元素,然后在上面绘制。
在这篇文章中,我们主要是分析如何画出指向和方框这两种批注。
正文
dom 结构
首先,我们先创建一个 canvas 节点,这里我们用 vue 项目来实现。
1
2
3
4
5
6
7
8
9
| <script setup lang="ts">
import { ref } from 'vue'
const canvasRef = ref<HTMLCanvasElement | null>(null)
</script>
<template>
<canvas ref="canvasRef" width="1280" height="720"></canvas>
</template>
|
这里我们固定了宽高,当然实际上在 resize 事件(或者 ResizeObserver 观察器)时,我们可能需要重新设置 canvas 的宽高,这里我们简单处理。
接着我们要处理事件,这里我们主要需要三个事件,mousedown , mousemove 和 mouseup ,这里我们用了 vueuse/core ,主要是使用 useEventListener 这个组合式 api 。
这样我们可以专注于逻辑,而不用去在意事件的绑定与解绑。
1
2
3
4
5
6
7
8
9
10
11
12
13
14
15
16
17
18
19
20
| <script setup lang="ts">
import { ref } from 'vue'
import { useEventListener } from '@vueuse/core'
const canvasRef = ref<HTMLCanvasElement | null>(null)
let mousedown = false
useEventListener(canvasRef, 'mousedown', () => {
mousedown = true
})
useEventListener('mousemove', () => {
if (!mousedown) {
return
}
})
useEventListener('mouseup', () => {
mousedown = false
})
</script>
|
接下来我们要考虑下存储的数据结构,在剪映中,数据结构如下:
1
2
3
4
5
6
7
8
9
10
11
12
| interface AnnotationItem {
type: 'rect' | 'arrow'
from: {
x: number
y: number
}
to: {
x: number
y: number
}
}
|
当然,这里我们只保留一些核心的字段,在剪映中还有一些额外的字段,比如批注的颜色 color 字段,这里我们从简,统一使用 #ff0000 红色。
然后我们需要有两个变量来保存批注对象,其中一个为 annotationList ,保存已经不再变化的批注对象,另一个为 currentAnnotationItem , 保存当前正在创建的批注对象
这里我们需要一些坐标相关的计算,需要使用 vueuse/core 的 useElementBounding 来获取 canvas 的盒子信息
1
2
3
4
5
6
7
8
9
10
11
12
13
14
15
16
17
18
19
20
21
22
23
24
25
26
27
28
29
30
31
32
33
34
35
36
37
38
39
40
41
42
43
44
45
46
47
48
49
50
51
52
53
54
55
56
57
58
59
60
61
62
63
64
65
66
67
68
| <script setup lang="ts">
import { ref } from 'vue'
import { useEventListener } from '@vueuse/core'
interface AnnotationItem {
type: 'rect' | 'arrow'
from: {
x: number
y: number
}
to: {
x: number
y: number
}
}
const canvasRef = ref<HTMLCanvasElement | null>(null)
let mousedown = false
const annotationList = ref<AnnotationItem[]>([])
const currentAnnotationItem = ref<AnnotationItem | null>(null)
const {
left: canvasLeft,
top: canvasTop,
width: canvasWidth,
height: canvasHeight,
} = useElementBounding(canvasRef)
useEventListener(canvasRef, 'mousedown', ({ clientX, clientY }: MouseEvent) => {
mousedown = true
currentAnnotationItem.value = {
type: 'rect',
from: {
x: clientX - canvasLeft.value,
y: clientY - canvasTop.value,
},
to: {
x: 0,
y: 0,
},
}
})
useEventListener('mousemove', ({ clientX, clientY }: MouseEvent) => {
if (!mousedown) {
return
}
Object.assign(currentAnnotationItem.value!.to, {
x: clientX - canvasLeft.value,
y: clientY - canvasTop.value,
})
})
useEventListener('mouseup', ({ clientX, clientY }: MouseEvent) => {
if (mousedown) {
mousedown = false
Object.assign(currentAnnotationItem.value!.to, {
x: clientX - canvasLeft.value,
y: clientY - canvasTop.value,
})
annotationList.value.push(Object.assign({}, currentAnnotationItem.value))
currentAnnotationItem.value = null
}
})
</script>
|
现在我们已经得到了一个批注对象,接下来我们就需要将这个对象画到画布上面。
上面的代码中,在 mousedown 中使用了 type = "rect" 来初始化批注对象。
所以我们先来讲讲怎么画矩形标注。
矩形标注
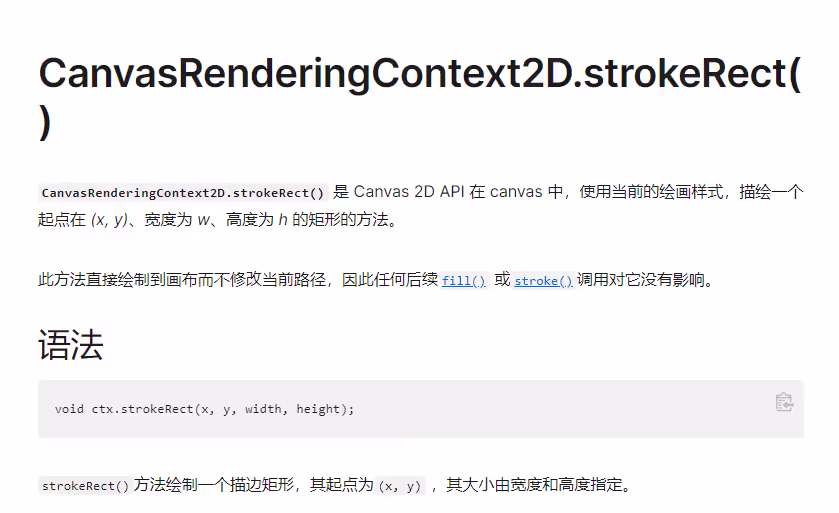
在 Canvas 的 2D 上下文中,已经有一个现成的绘制矩形的 API 了,即 strokeRect(x, y, w, h) 。
![]()
这四个参数分别是,起始点的横坐标,起始点的纵坐标,矩形的宽,矩形的高。
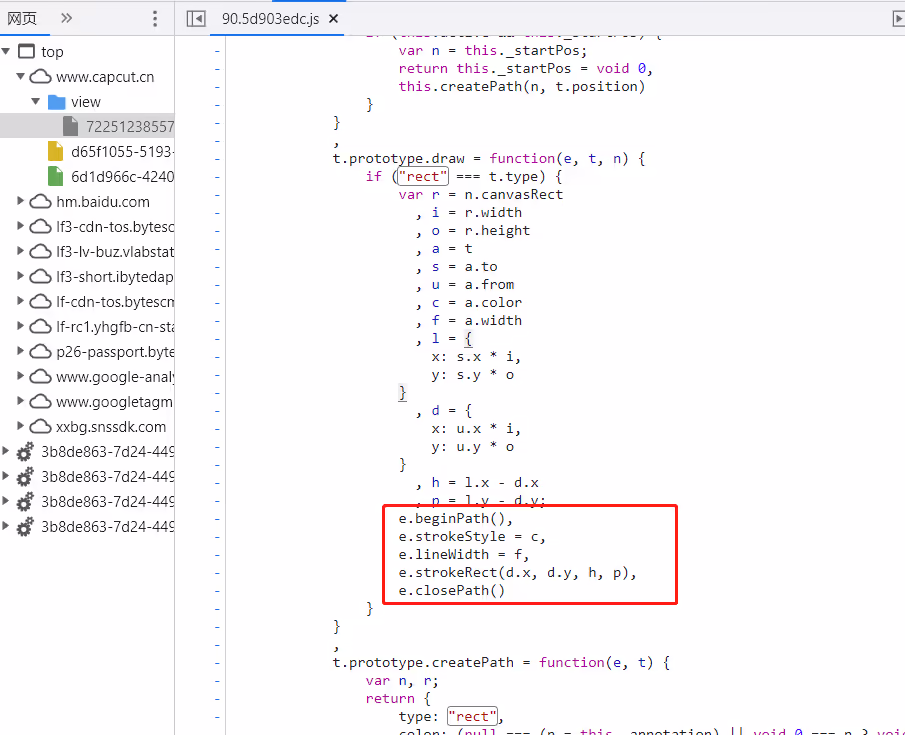
这里我们可以看到剪映用的也是这个 API 。
![]()
现在我们的代码中保存了 currentAnnotationItem 这个对象,这个对象里面有起始点坐标和结束点坐标。
所以 API 需要的四个参数我们都能通过计算得到,我们写一个 drawRect 函数来绘制 currentAnnotationItem 所表示的矩形。
1
2
3
4
5
6
7
8
9
10
11
| const drawRect = () => {
const ctx = canvasRef.value!.getContext('2d')!
const { from, to } = currentAnnotationItem.value!
const width = Math.abs(from.x - to.x)
const height = Math.abs(from.y - to.y)
ctx.beginPath()
ctx.strokeStyle = '#ff0000'
ctx.lineWidth = 2
ctx.strokeRect(from.x, from.y, width, height)
ctx.closePath()
}
|
然后我们在 mousemove 事件中加上对这个函数的调用
1
2
3
4
5
6
7
8
9
10
11
12
| useEventListener('mousemove', ({ clientX, clientY }: MouseEvent) => {
if (!mousedown) {
return
}
Object.assign(currentAnnotationItem.value!.to, {
x: clientX - canvasLeft.value,
y: clientY - canvasTop.value,
})
drawRect()
})
|
效果如下:
![]()
可以发现现在的绘制存在两个问题:
- 问题 1 :每次绘制都会保留上次绘制的结果,导致显示错误。
- 问题 2 :由于我们固定起始点
from 为 strokeRect 的头两个参数,导致当结束点 to 在 from 的左上角时会出现绘制错误。
针对问题 1 ,我们需要在每次 mousemove 回调中的绘制前清除画布,我们实现一个 clearCanvas 函数,来清除画布上的当前内容。
清除画布的方法可以是调用 2D 上下文的 clearRect ,或者重新给 canvas 元素的宽高赋值,这里由于我们需要清空整个画布,所以用哪个都没差,这里我们使用后面的方法。
1
2
3
4
5
| const clearCanvas = () => {
const el = canvasRef.value!
el.width = el.width
el.height = el.height
}
|
然后我们在 mousemove 中的 drawRect 之前调用一次 clearCanvas 。
1
2
3
4
5
6
7
8
9
10
11
12
13
14
| useEventListener('mousemove', ({ clientX, clientY }: MouseEvent) => {
if (!mousedown) {
return
}
Object.assign(currentAnnotationItem.value!.to, {
x: clientX - canvasLeft.value,
y: clientY - canvasTop.value,
})
clearCanvas()
drawRect()
})
|
效果如下:
![]()
可以看到现在不会出现重叠的情况了。
接下来我们开始解决问题 2 ,从上面的图可能看不出来问题 2 的症状,下面这个图就比较清晰了。
![]()
在我们从右下往左上拖动的时候,矩形绘制的区域明显错误了。
这个问题的根本原因在于我们固定了 currentAnnotationItem.from 作为矩形的起始点。
绘制的时候我们总共会出现四个绘制方向,分别是:
- 最常见的就是左上到右下
- 左下到右上
- 右上到左下
- 右下到左上
接着我们一个个分析。
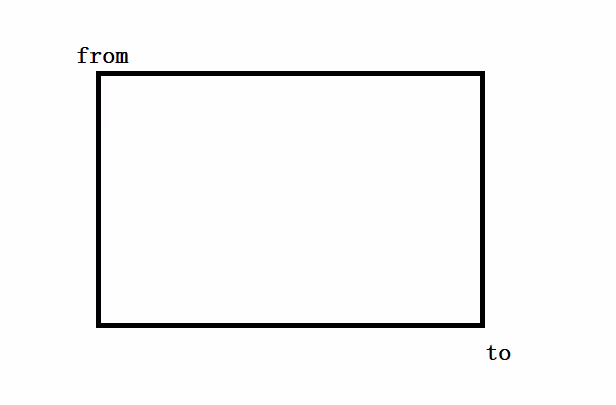
1. 左上到右下
![]()
很明显此时绘制矩形的顶点就是 from 的坐标,这个很容易看出来。
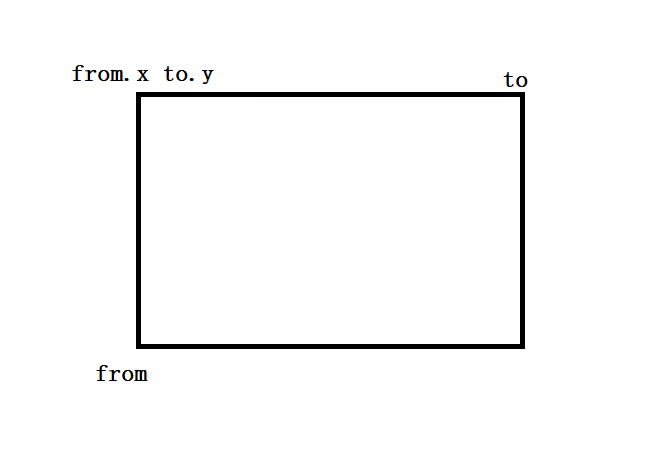
2. 左下到右上
![]()
此时矩形的顶点是 (from.x, to.y) 。
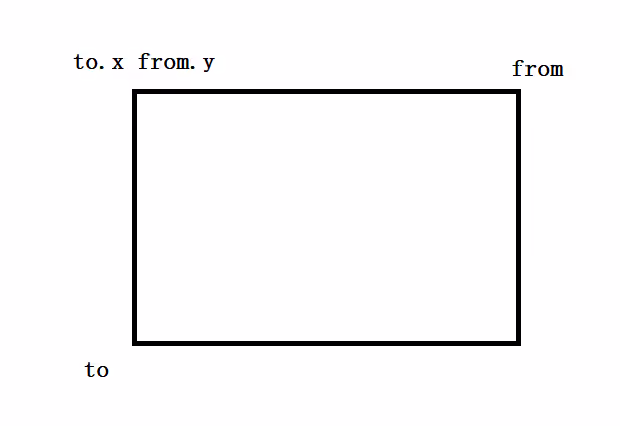
3.右上到左下
![]()
此时矩形的顶点是 (to.x, from.y) 。
4.右下到左上
![]()
此时矩形的顶点是 to 的坐标。
经过分析之后,我们可以发现我们应该分别取 from 和 to 两者横纵坐标的较小值,这样绘制出来的矩形才是正确的
所以我们改动下 drawRect 代码
1
2
3
4
5
6
7
8
9
10
11
12
13
14
15
16
17
18
| const drawRect = () => {
const ctx = canvasRef.value!.getContext('2d')!
const { from, to } = currentAnnotationItem.value!
const width = Math.abs(from.x - to.x)
const height = Math.abs(from.y - to.y)
ctx.beginPath()
ctx.strokeStyle = '#ff0000'
ctx.lineWidth = 2
ctx.strokeRect(
Math.min(from.x, to.x),
Math.min(from.y, to.y),
width,
height,
)
ctx.closePath()
}
|
经过修改之后,效果如下:
![]()
现在矩形绘制基本上正确了
箭头标注
这应该是本文最难的一个点了,在刚开始我也是不会的,不过我也是看了剪映里面的绘制代码,调试了很久才勉强懂得了过程。
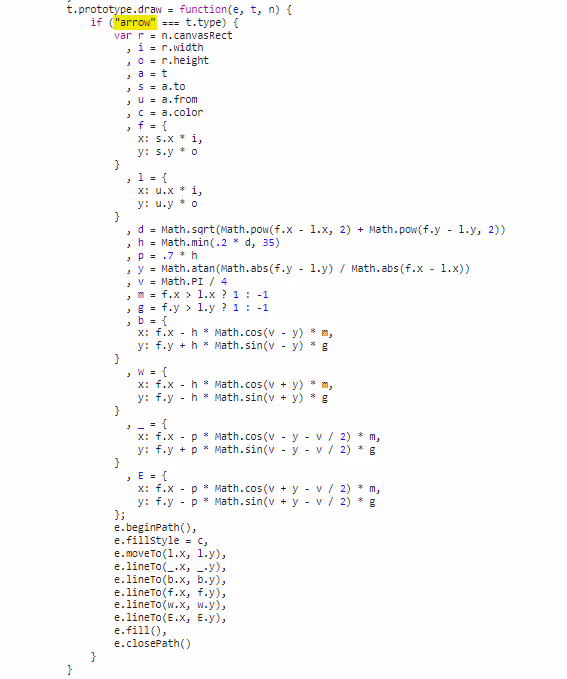
这里我们先放一下剪映的代码。
![]()
看起来还是相当复杂的,涉及了三角函数。
当然,这其中的基础是 2d 上下文的 moveTo , lineTo , fill API,分别是:
moveTo(x, y) 移动画笔到点 (x, y) 。lineTo(x, y) 从起始点到 (x, y) 连接一条路径。fill() 填充绘制路径围成的区域。
在剪映的代码中,最后就是调用这 3 个 API 来绘制图形
1
2
3
4
5
6
7
8
9
10
11
12
13
| t.prototype.draw = function () {
e.beginPath()
e.fillStyle = c
e.moveTo(l.x, l.y)
e.lineTo(_.x, _.y)
e.lineTo(b.x, b.y)
e.lineTo(f.x, f.y)
e.lineTo(w.x, w.y)
e.lineTo(E.X, E.y)
e.fill()
e.closePath()
}
|
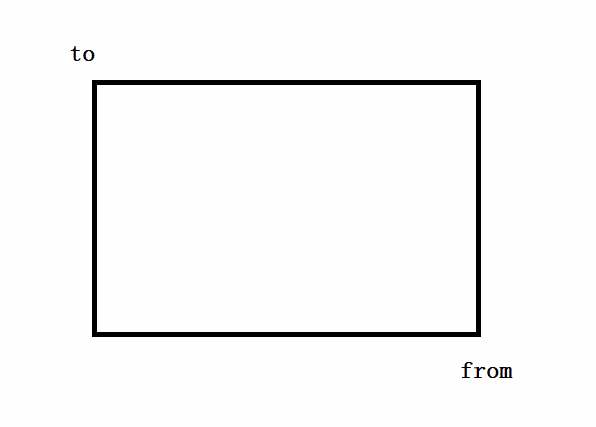
这里的每个点就是箭头标注的点,总共 6 个点,即 7 条边。
![]()
那么我们现在就是要求出这 6 个点的坐标,其他就水到渠成了。
其中两个点其实我们已经得到了,分别是 from 和 to ,对应的代码为 e.moveTo(l.x, l.y) 和 e.lineTo(f.x, f.y) 。
我们可以把剪映的代码稍稍转换一下,如下:
1
2
3
4
5
6
7
8
9
10
11
12
13
14
15
16
17
18
19
20
21
22
23
24
25
26
27
| t.prototype.draw = function () {
d = Math.sqrt(Math.pow(to.x - from.x, 2) + Math.pow(to.y - from.y, 2))
h = Math.min(0.2 * d, 35)
p = 0.7 * h
y = Math.atan(Math.abs(to.y - from.y) / Math.abs(to.x - from.x))
v = Math.PI / 4
m = to.x > from.x ? 1 : -1
g = to.y > from.y ? 1 : -1
b = {
x: to.x - h * Math.cos(v - y) * m,
y: to.y + h * Math.sin(v - y) * g,
}
w = {
x: to.x - h * Math.cos(v + y) * m,
y: to.y - h * Math.sin(v + y) * g,
}
_ = {
x: to.x - p * Math.cos(v - y - v / 2) * m,
y: to.y + p * Math.sin(v - y - v / 2) * g,
}
E = {
x: to.x - p * Math.cos(v + y - v / 2) * m,
y: to.y - p * Math.sin(v + y - v / 2) * g,
}
}
|
首先变量 d 很容易看出来是计算点 from 和点 to 围成矩形的对角线的长度,这个公式是我们很熟悉的勾股定理 z2 = x2 + y2 。
变量 h 和 p 分别是根据变量 d 计算的一个的长度,往下看,可以发现分别对应去计算了两个点的坐标,其中变量 h 对应变量 b 和变量 w ,变量 p 对应变量 _ 和变量 E 。
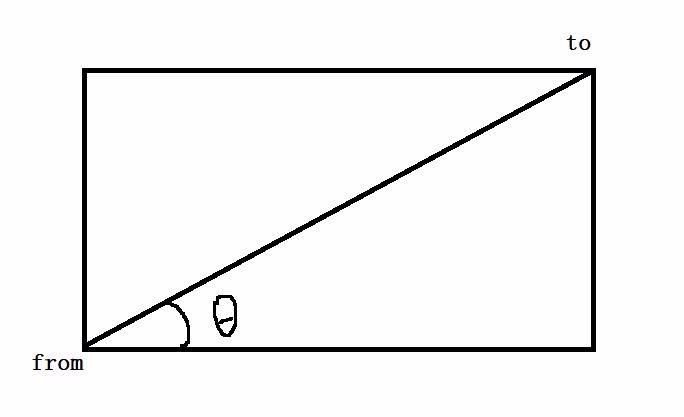
y 则是矩形的对角线和横向形成的对角线,即下图的角 θ 。
![]()
Math.atan() 就是 Math.tan() 的“相反面”,它有一个专业的术语,叫反正切。
对于 Math.tan() ,传入角度,得到对边与领边的比值,而 Math.atan() 则是传入对边与领边的比值,得到角度。
v 则是 Math.PI 的 1/4 ,Math.PI 表示 180° , 1/4 也就是 45° 。
m 和 g 则是用来补偿正负判断的。
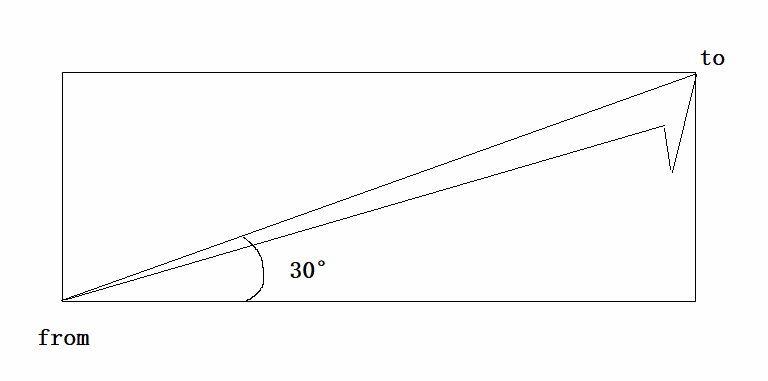
接下来我们假设从左下移动到右上,且夹角为 30° ,此时正负补偿都是 1 ,我们可以忽略这两个变量。
我们以下半部分的箭头来分析,此时如下:
![]()
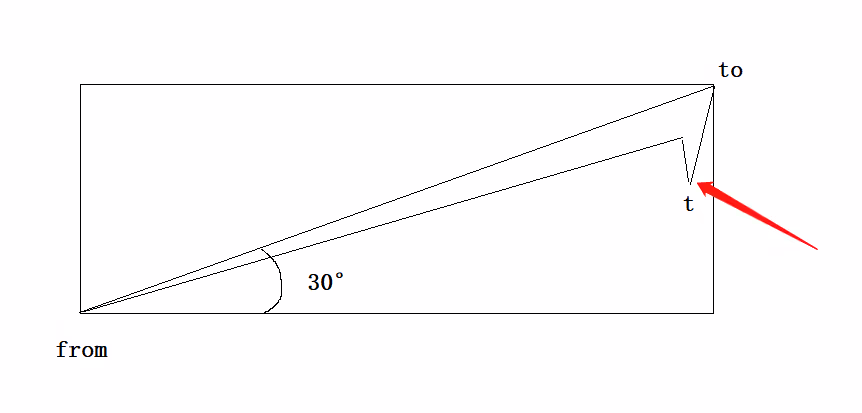
接下来我们分析下下图中标的点,这里我们标为点 t 。
![]()
结合代码可以发现,由于四个待求的点 b, w, _, E 都是通过目标点 to 来进行转化的,而此时点 t 的横纵坐标应该都要小于 to ,即 to 的横纵坐标都要减去某个值来得到点 t 。
那么此时可以排除 b 和 _ ,剩下 w 和 E 。
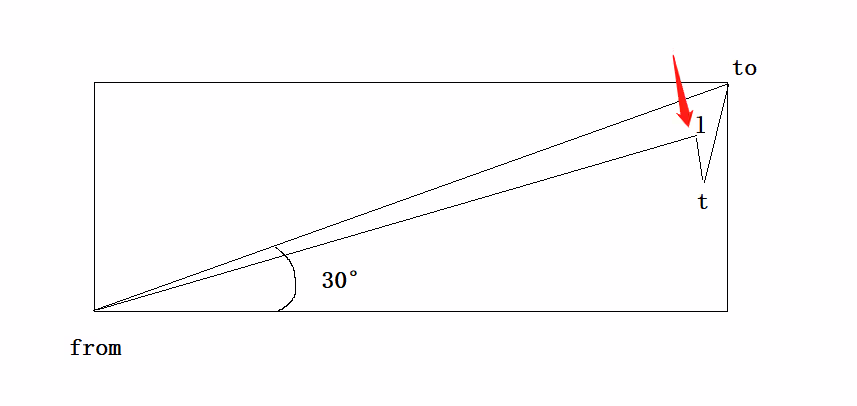
在箭头的一边包含两个点,除了点 t ,还有一个 点 l ,如下图:
![]()
那么 w 和 E 应该就对应了这两个点。
此时我们假设 w 对应点 t ,然后我们分析是否符合。
此时 w 的计算如下(正负补偿已忽略):
1
2
3
4
| w = {
x: to.x - h * Math.cos(v + y),
y: to.y - h * Math.sin(v + y),
}
|
可以发现通过 h 来以及正余弦来得出偏移量,那么我们可以确此时 h 就是斜边,而 h * Math.cos(v + y) 和 h * Math.sin(v + y) 就是直角边。
那么我们可以得出此时构造的直角三角形应该如下图所示:
![]()
此时角 α + 角 β 的值即为 y + v(45°) ,所以 h * Math.cos(v + y) 得出了偏移量 px ,h * Math.sin(v + y) 得出了偏移量 py 。
![]()
那么 t 的坐标也就的出来了。
同理我们分析 l 坐标,我们可以同样构造三角形,但是我们发现角度额外减少了 22.5°, 即 v(45°)/ 2 。
以及使用 p( =0.7 * h ) 来作为斜边,而不是 h ,此时我们把点 l 和 点 to 连接起来,此时两点的长度就是 p 。
我们直接上图,更容易理解:
![]()
此时 角 α + 角 β 的值即为 y + v / 2(22.5°) 。
其他的就和点 t 的计算过程一样了。
当然这里需要注意的是,v 的角度其实是可以自定义的,即如果你增大了 v 值,那么箭头顶部就会更加往外扩大,而如果你减小 v 值,那么箭头顶部就会往内收敛。
除此之外,h 和 p 也是可以自定义的,这两者决定了箭头的形状以及大小范围。
理解了计算过程后,我们就可以模仿(照抄)剪映写出 drawArrow 的代码了。
1
2
3
4
5
6
7
8
9
10
11
12
13
14
15
16
17
18
19
20
21
22
23
24
25
26
27
28
29
30
31
32
33
34
35
36
37
| const drawArrow = () => {
const ctx = canvasRef.value!.getContext('2d')!
const { from, to } = currentAnnotationItem.value!
const d = Math.sqrt(Math.pow(from.y - to.y, 2) + Math.pow(from.x - to.x, 2))
const h = Math.min(d * 0.2, 35)
const v = Math.PI / 4
const y = Math.atan(Math.abs(to.y - from.y) / Math.abs(to.x - from.x))
const p = 0.7 * h
const m = to.x > from.x ? 1 : -1
const g = to.y > from.y ? 1 : -1
const p1 = {
x: to.x - h * Math.cos(v - y) * m,
y: to.y + h * Math.sin(v - y) * g,
}
const p2 = {
x: to.x - h * Math.cos(v + y) * m,
y: to.y - h * Math.sin(v + y) * g,
}
const p3 = {
x: to.x - p * Math.cos(v - y - v / 2) * m,
y: to.y + p * Math.sin(v - y - v / 2) * g,
}
const p4 = {
x: to.x - p * Math.cos(v + y - v / 2) * m,
y: to.y - p * Math.sin(v + y - v / 2) * g,
}
ctx.beginPath()
ctx.fillStyle = '#ff0000'
ctx.moveTo(from.x, from.y)
ctx.lineTo(p3.x, p3.y)
ctx.lineTo(p1.x, p1.y)
ctx.lineTo(to.x, to.y)
ctx.lineTo(p2.x, p2.y)
ctx.lineTo(p4.x, p4.y)
ctx.fill()
ctx.closePath()
}
|
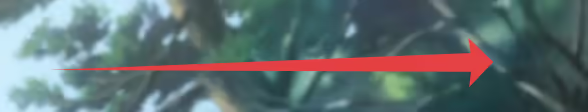
然后我们可以看下效果图,如下:
![]()
相关的代码已经上传到我的仓库了,可以自行拉下来跑跑试试看。
当然,如果你想把代码放到业务中,可能还需要改一下,首先就是不能使用绝对值坐标来存,而应该使用百分比,因为每个人的屏幕分辨率可能不一样,这也是目前剪映的实现方法。
另外,也可以多自定义变量,比如颜色,方框的粗细等。
当然,标注的画布应该保持一个固定的长宽比,不然缩小屏幕可能会出现错位的情况。
后记
三角函数不用真的都快忘光了,虽然从 0 到 1 我不是很行,但是从 0.99 到 1 我还是可以的😂。
目前也已经把剪映这个页面的功能都搬到了我们公司的项目上。
不过我挺讨厌抄的…
嘛,不过工作嘛,完成工作而已,不要想太多。